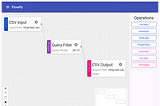
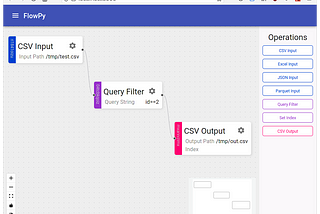
InTDS ArchivebyPatty CIntroducing FlowPy — an intuitive front end for processing data with PythonManipulate Pandas data frames from the comfort of your own browser!Jul 1, 20215Jul 1, 20215
InTDS ArchivebyGeir FreyssonAnalysing survey data with Python and Jupyter NotebooksThe Notebook environment is perfect for the ad-hoc nature of working with survey dataOct 8, 20193Oct 8, 20193
InTDS ArchivebyFilip CiesielskiHow to use the Split-Apply-Combine strategy in Pandas groupbyMaster the Split-Apply-Combine pattern in Python with this visual guide to Pandas groupby-apply.Jul 16, 20198Jul 16, 20198
InTDS ArchivebyDarío WeitzIndicators with PlotlyAngular Gauge or Bullet Chart?Aug 12, 2021Aug 12, 2021
InTDS ArchivebyMartin HeinzTour of Python ItertoolsLet’s explore two great Python libraries — itertools and more_itertools and see how to leverage them for data processing…Feb 15, 20206Feb 15, 20206
InTDS ArchivebyEmma BoudreauWicked Fast Python With ItertoolsA quick look at an easy way to make Python faster and more effective for machine-learning by using the itertools module.Apr 4, 20215Apr 4, 20215
InTDS ArchivebyYong Cui5 Advanced Functions in Itertools To Simplify Iterations in PythonGet the power-ups to make some otherwise complex iterations easierApr 3, 20201Apr 3, 20201
InTDS ArchivebyTDS EditorsTo Learn Data Science Faster, Teach It“I refused to accept my negative thoughts.”May 5, 20211May 5, 20211
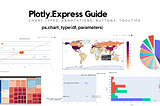
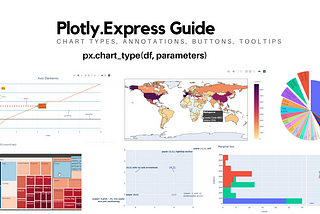
InTDS ArchivebyVaclav DekanovskyVisualization with Plotly.Express: Comprehensive guideOne dataset and over 70 charts. Interactivity and animation often in a single line of code.Oct 15, 20208Oct 15, 20208
InTDS ArchivebyElizabeth Ter SahakyanHow To Create a Plotly Visualization And Embed It On WebsitesPlotly is an open-soure, simple-to-use charting library for python. Plotly.express was built as a wrapper for Plotly.py to make creating…Sep 9, 201913Sep 9, 201913
InTDS ArchivebyRashida Nasrin SuckyA Collection of Advanced Visualization in Matplotlib and Seaborn with ExamplesEnriching the Visualization Techniques and SkillsNov 27, 2020Nov 27, 2020
InTDS ArchivebyRashida Nasrin SuckyA Collection of Advanced Data Visualization in Matplotlib and SeabornMake Your Storytelling More InterestingDec 28, 20202Dec 28, 20202
InTDS ArchivebyRashida Nasrin SuckyAn Ultimate Cheat sheet of Data Visualization with Python’s Seaborn LibraryA great resource for learners as wellFeb 4, 20212Feb 4, 20212
InTDS ArchivebyBadreesh ShettyData Visualization using MatplotlibData Visualization is an important part of business activities as organizations nowadays collect a huge amount of data. Sensors all over…Nov 12, 20186Nov 12, 20186
InTDS ArchivebyKhuyen TranTop 6 Python Libraries for Visualization: Which one to Use?Confused about which Visualization Tool to Use? I Broke Down the Pros and Cons of Each Libary for YouJul 24, 202010Jul 24, 202010
InProductive Data SciencebyTirthajyoti SarkarWhy and how should you learn “Productive Data Science”?What is Productive Data Science and what are some of its components?Nov 4, 20211Nov 4, 20211
InProductive Data SciencebyTirthajyoti SarkarFaster iteration in PandasWhenever possible, use the df.values method instead of the iterrows method for faster iteration. Even better, vectorize where possible.Jul 30, 20211Jul 30, 20211
InTDS ArchivebyCharlene ChamblissCleaning, Analyzing, and Visualizing Survey Data in PythonA tutorial using pandas, matplotlib, and seaborn to produce digestible insights from dirty dataMar 30, 20196Mar 30, 20196
InTDS ArchivebyJames AsherHow To Analyze Survey Data In PythonHere are some tips, with code, to clean, analyze and visualize survey data in Python.Apr 12, 2021Apr 12, 2021